


Why estimate the burden of diarrhea?
|
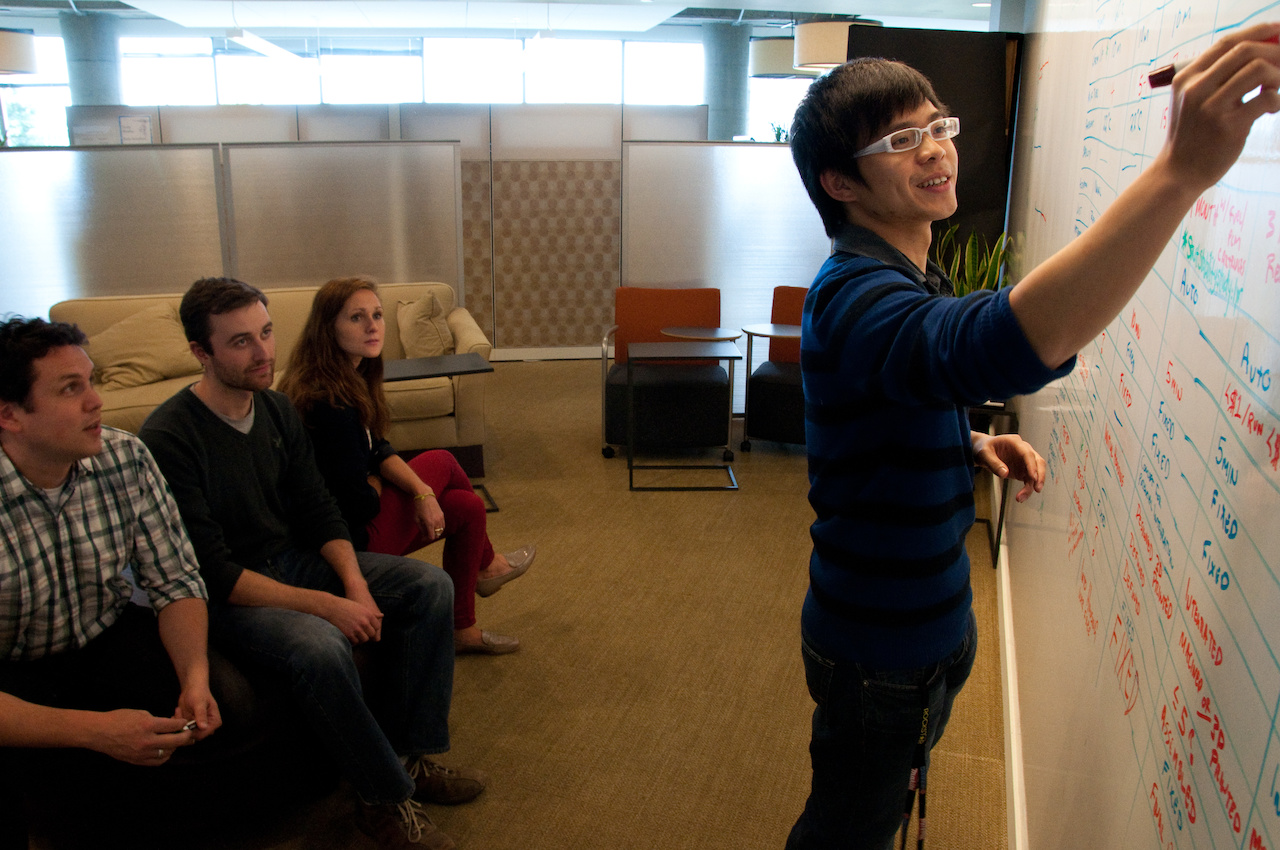
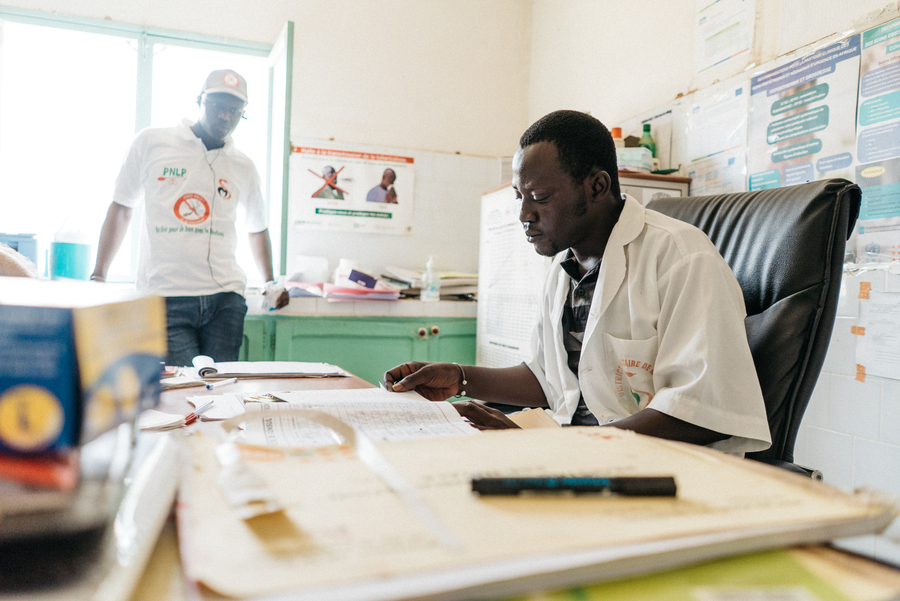
Photo: PATH/Patrick McKern.
In our previous post, we discussed the different types of data that we use to estimate the global burden of diarrhea. In this post, we’ll answer a question that we get asked frequently: Why? Why do all of this work for estimates instead of simply presenting the data points?
The answer has a bit to do with the “strength in numbers” of all of the sources that we use, a bit to do with the work that goes in to making these sources – and diseases – comparable, and a lot to do with getting a more accurate picture of population health around the world that’s comprehensive rather than piecemeal.
Many widely used numbers, ranging from gross domestic product (GDP) to weather forecasts, use estimation techniques to provide the best information possible. In the case of the Global Burden of Disease study (GBD), statistical estimation techniques make it possible to identify the health loss associated with diarrhea and other illnesses and diseases. This ability to explore and compare is an essential part of what makes modeled estimates a powerful tool for policymaking and priority-setting to make people healthier.
The myth of "perfect" data
Intuitively, it might seem that raw data – e.g., the results of a census or the findings of a study – are the “truth,” and that any estimation process only serves to adulterate these raw data.
The truth is there is no such thing as “perfect” data. Consider that most data sources only cover a narrow slice of time and therefore cannot tell us about the state of health over the two decades for which the GBD produces estimates. And, on top of that, any single data source might have used distinctive data collection practices, such as a uniquely enthusiastic interviewer or inconsistent household interview targets, which could produce different data compared to another survey.
One example of bias in raw data comes from surveys on diarrhea prevalence. Community surveys are typically conducted over a few months of the year, yet diarrhea in many locations has a seasonal pattern. If we were to base our understanding of diarrhea on a period of time in which diarrhea prevalence may be higher or lower than the year on average, we would introduce unknown bias into our estimates. To attempt to remove this effect, we include surveys from neighboring countries that together give information about the entire year and use a statistical model to adjust data so that they are more representative of the year as a whole than a subset of that year.
As we combine all of these considerations, we begin to see just how complicated it can be to find the data that allow for global estimates of death and disability due to diarrhea. With imperfect data, the best we can do to try to be as accurate as possible is compile different data sources and studies, then evaluate them to see what story they are telling us.
When data are high quality, so are GBD estimates
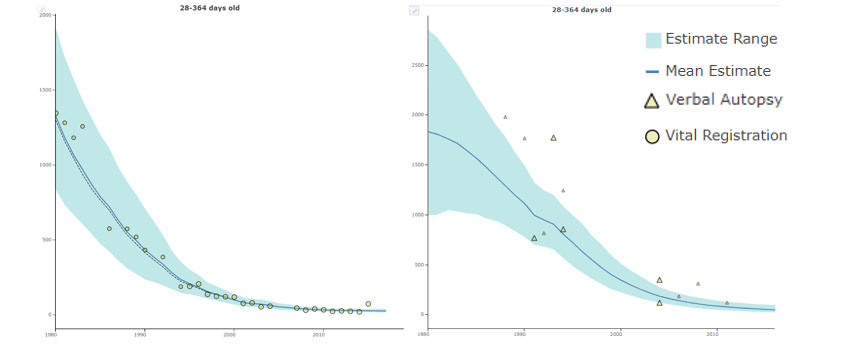
When raw data are high quality, the GBD estimates tend to align with them. For example, the graph shows how diarrhea mortality estimates (blue solid line) for Peru (left) and Bangladesh (right) align closely with the data (yellow dots) for many years. High-quality data boost the strength of GBD estimates.
Diarrhea mortality estimates and raw data (deaths per 100,000), children 28-364 days old. Results are shown for Peru (left) and Bangladesh (right)
Without estimates, there would be no Global Burden of Disease values
Estimates can empower decision makers to answer questions such as:
- What causes more disease burden in my country: cancer or diarrhea?
- What are the dominant health problems among older and younger people in my country?
- How has the burden of diarrhea in my country changed over time?
- How does my country’s diarrhea burden and its risk factors compare to our neighbors?
Estimation techniques are essential for measuring burden of disease. Since raw data are not perfect and can’t give us a complete or comparable picture of health worldwide, estimates are a useful tool for helping decision-makers develop a better understanding of health trends in their country, region, and around the world.
Our next post will explore some of the techniques we use to estimate the global burden of diarrhea.
Interested in learning more? This post draws from our Acting on Data blog and the work of the Institute for Health Metrics and Evaluation (IHME).


