Data sources for the Global Burden of Diarrhea
|
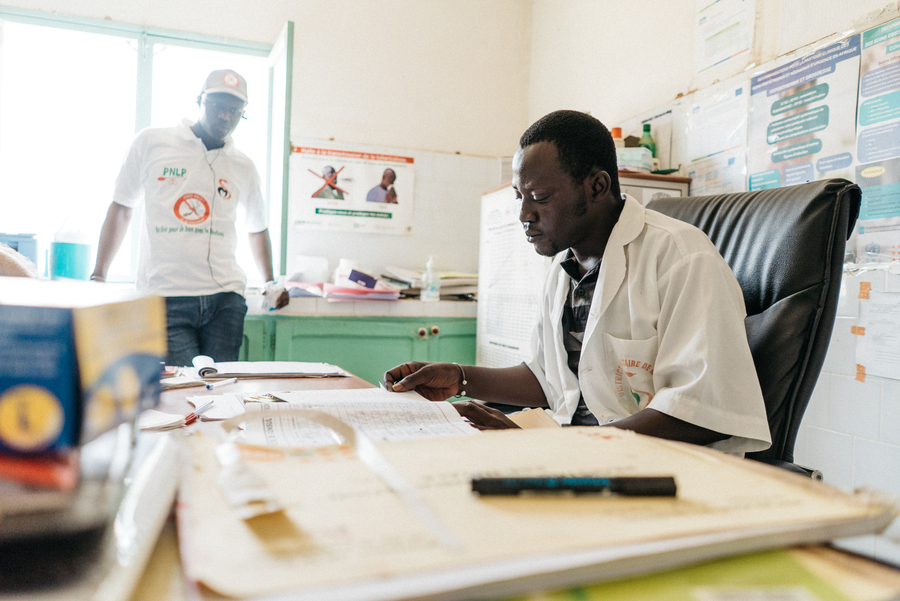
Photo: PATH/Gabe Bienczycki.
Estimates are only as strong as the evidence on which they are built. The Global Burden of Disease (GBD) study, covered on our previous DefeatDD blog post, produces thousands of estimates of morbidity and mortality around the globe. Because these estimates can inform real-world policy decision-making and implementation, such as diarrhea prevention and control policies, they have to be built on good data – and a lot of it.
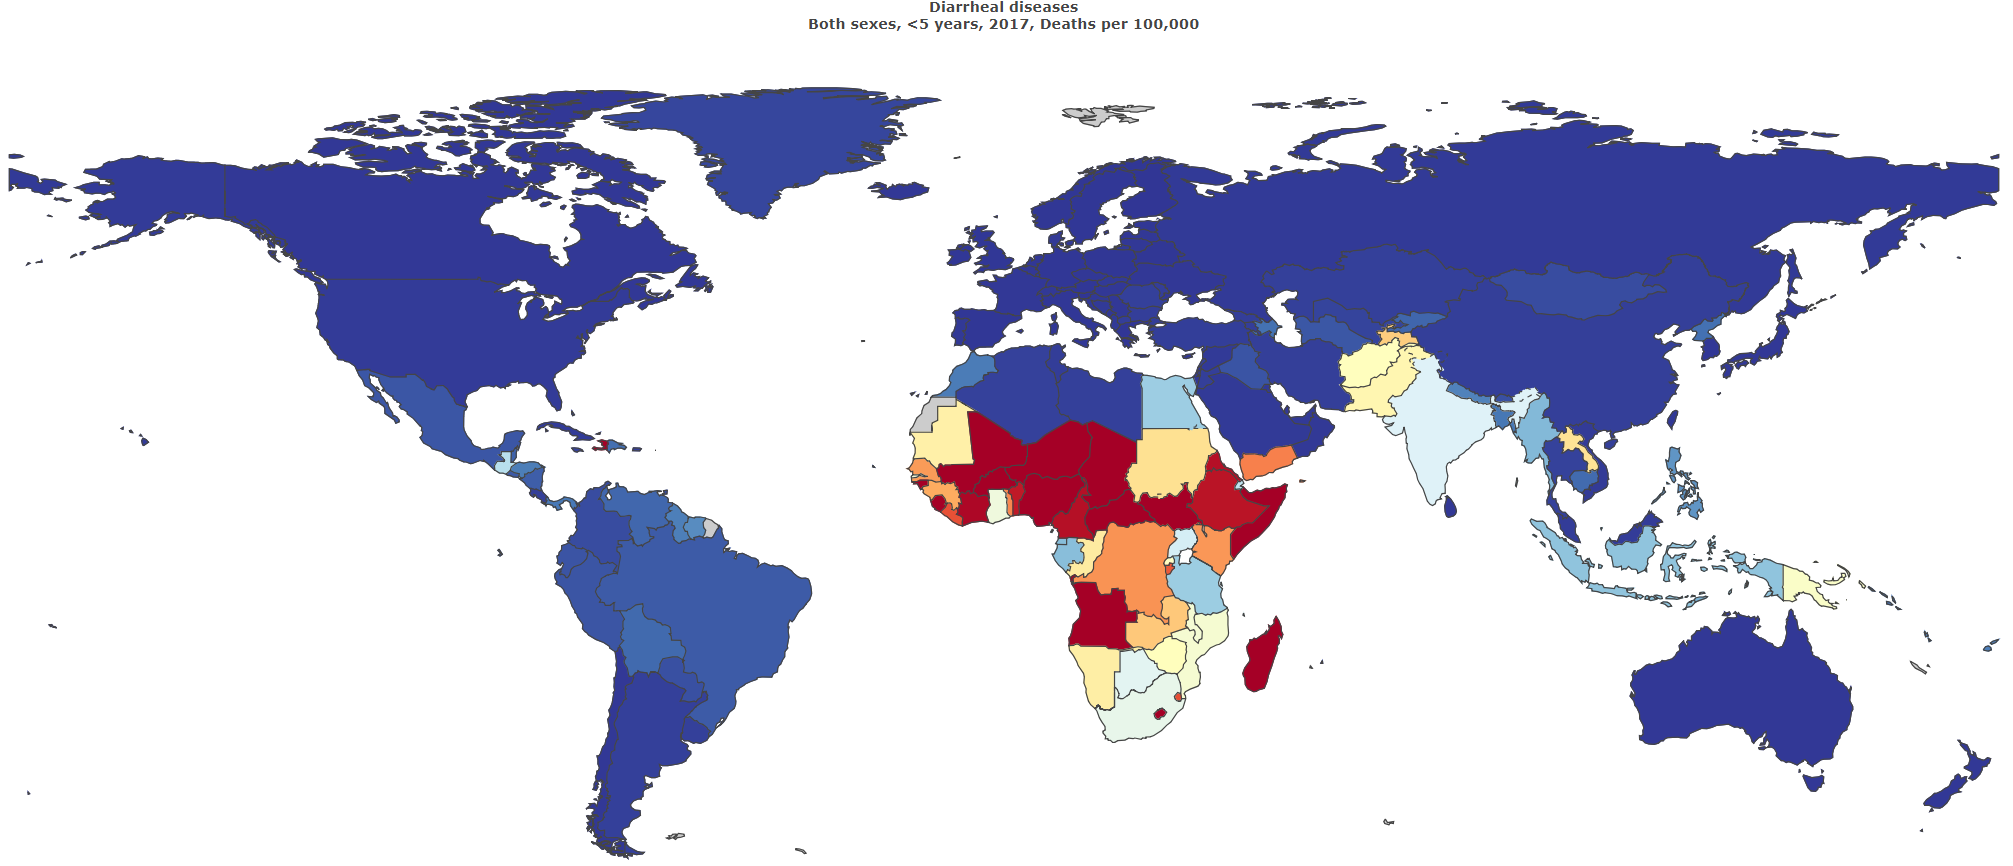
To produce good estimates, GBD pulls in a lot of diverse data sources. The 2017 GBD diarrhea estimates, published in 2018, drew from more than 1,600 data sources and nearly a million data points that tell the story of diarrhea mortality and morbidity around the world.
What does a "data source" look like?
The variety of data sources is a key part of the work:
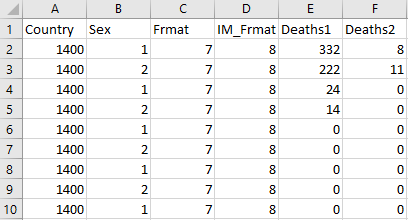
- Censuses share data about every member of a population – like from a country or a town – at a single point in time.
- Birth and death registrations complement other sources of data with the ongoing “vital” events that happen every day.
- Other sources provide finer detail, such as: disease registries (central databases that collect information on specific diagnoses, such as cancer or diabetes), surveys (both local and international), scientific literature, and a host of other sources large and small.
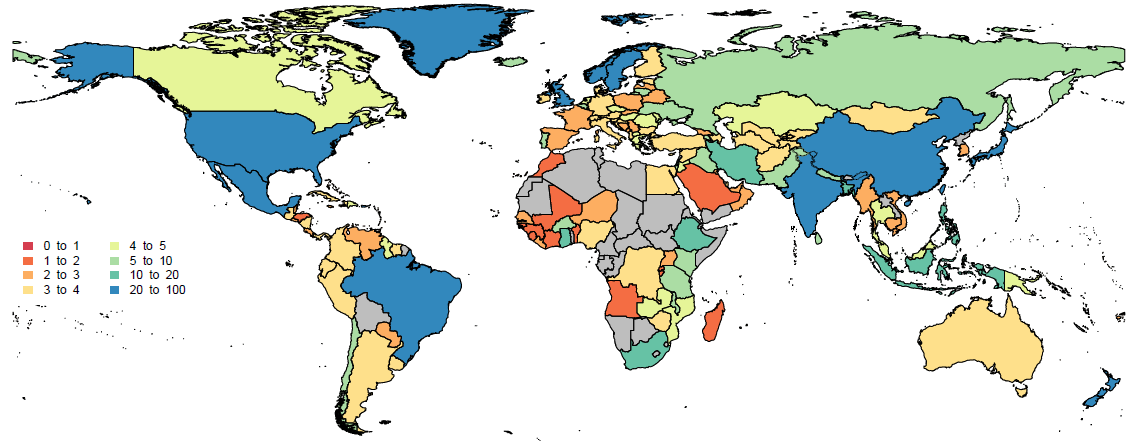
In areas of the world that lack consistent and complete censuses and vital registration systems, GBD uses some unusual data sources. For verbal autopsy data, for example, trained staff interview the relatives of a recently deceased person to obtain information on their signs, symptoms, and demographic characteristics in order to determine their likely cause of death. Verbal autopsy data are especially important in informing diarrhea mortality estimates in low-resource areas of South Asia and sub-Saharan Africa.
This diversity of sources is a key part of both GBD’s existence and its strength. Every country and organization has its own methods and systems for collecting information, and it is important to draw from a range of sources whenever possible to help create a more complete picture of the world’s health.
Where do all these data come from?
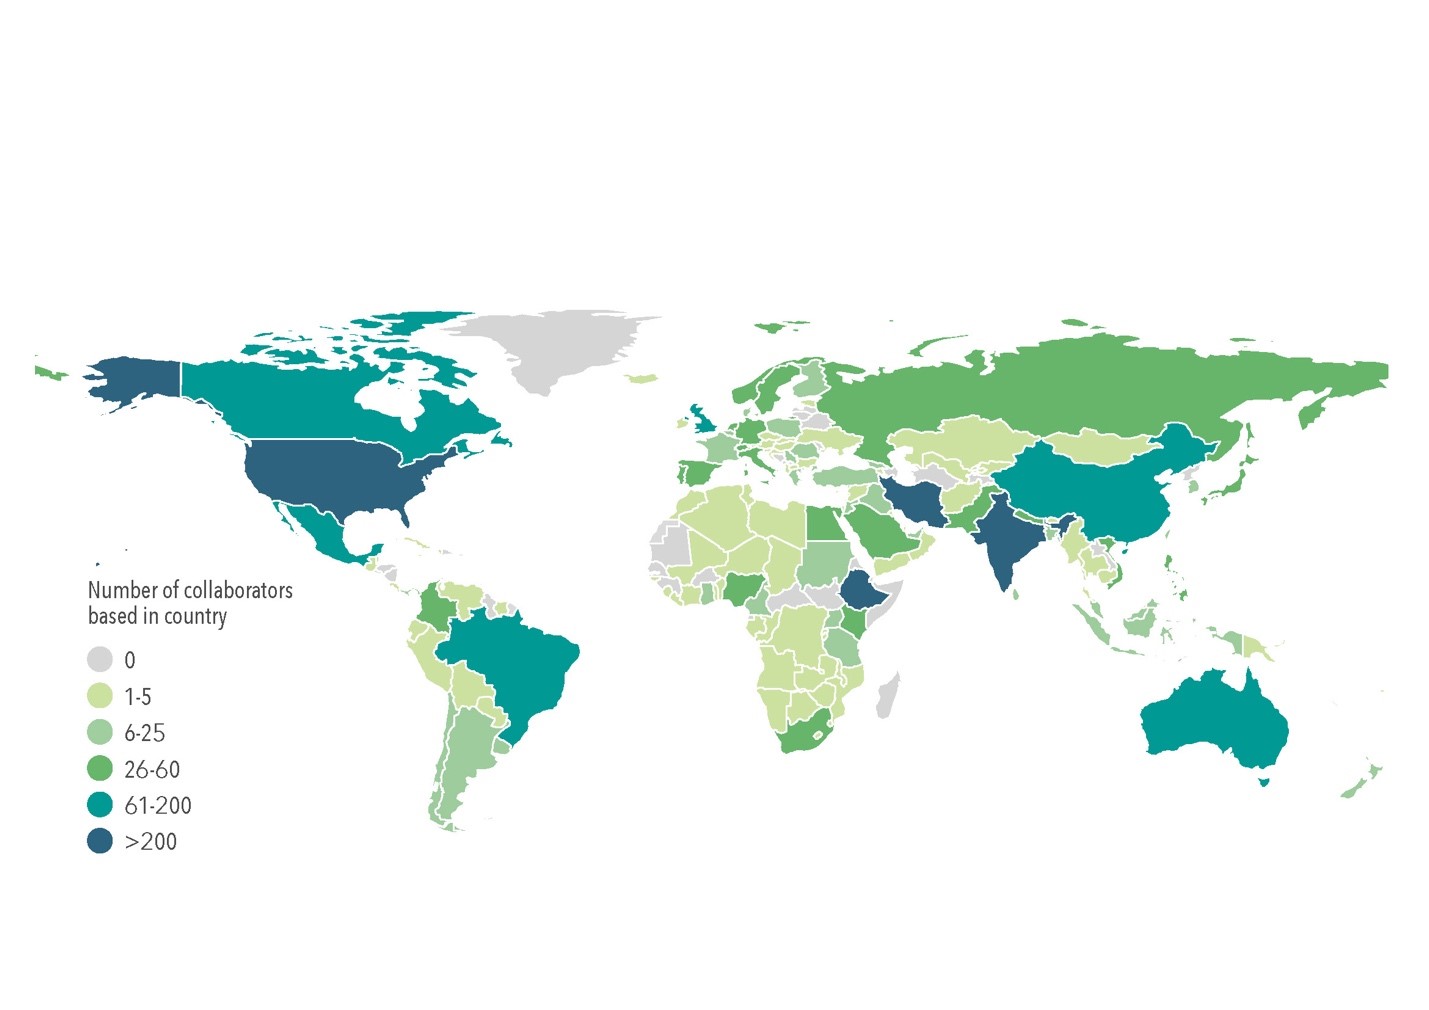
Some data sources used are publicly available, published by organizations like WHO and countries like Brazil, a country that has made an incredible effort to publicize its national statistics. Other sources are shared by partners or through our network of 3,500+ collaborators, who help us learn more about these data sources and the context of data collection across different countries and organizations.
IHME shares information about the datasets used in the GBD study via the Global Health Data Exchange (GHDx). Not only does this increase transparency, but it also helps us to find out if we missed important datasets, so that every year GBD estimates can be more accurate.
In our next post, we’ll discuss why we use these data sources to estimate the global burden of diarrhea instead of simply presenting the data points.
Interested in learning more? This post draws from our Acting on Data blog and the work of IHME.