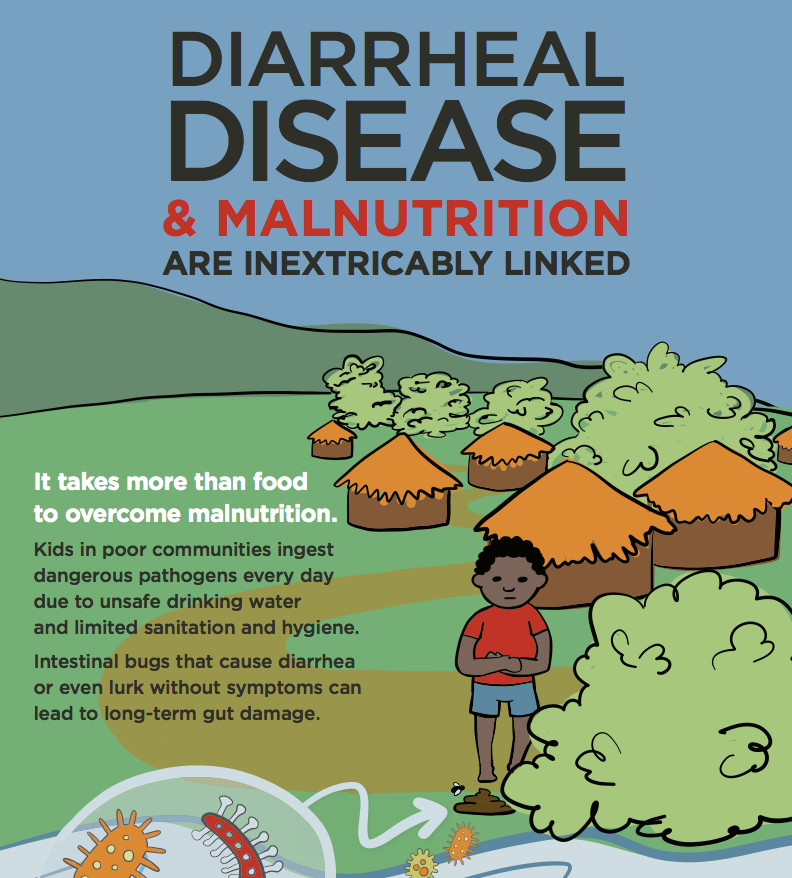
Using data visualization to tell the full story about diarrhea
|
For non-technical viewers, data often lacks accessibility. But when data is broken down and refined through visualization, it can become a compelling storyteller and tool in evidence-based decision-making.
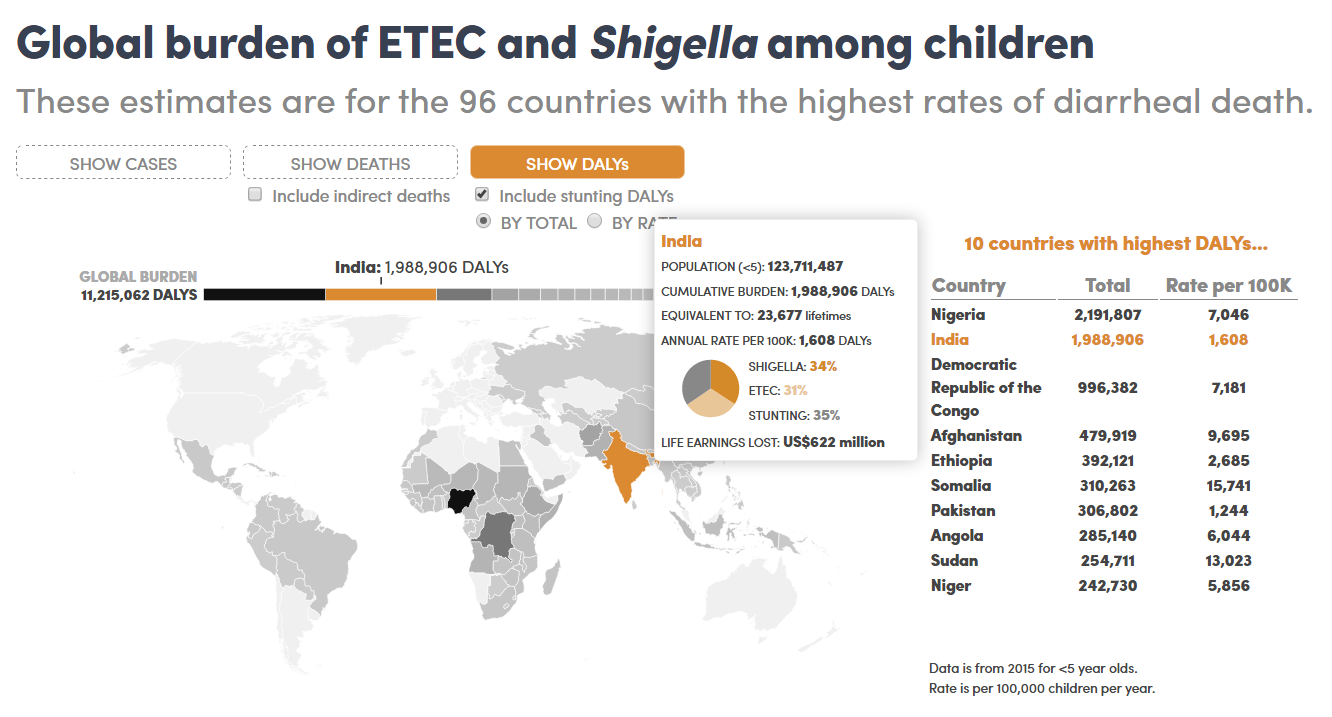
DefeatDD recently launched a data visualization tool to tell the full story behind the global burden of ETEC and Shigella diarrhea. The visualization uses a new set of disease burden estimates—including cases, deaths, and long-term consequences—that PATH's health economics team has been developing with Dr. Richard Rheingans and his team at the University of Florida. I sat down with Farzana Muhib, one of PATH's health economists who helped analyze the data, to get her take.
LE: So first of all, why were disease burden estimates for ETEC and Shigella needed?
FM: There are currently two sets of global diarrheal disease burden estimates that approximate the number of deaths caused by ETEC and Shigella. However, estimates of illness and indirect effects—such as the number of children stunted due to these pathogens—do not exist. It was important for our team to start to capture the extent to which these two pathogens are responsible for moderate-to-severe diarrhea cases as well as stunting. Because while diarrheal mortality is rapidly decreasing, the number of cases is not. A vaccine would not only reduce the number of deaths but also the number of cases occurring from these pathogens.
LE: How did the University of Florida team generate the disease burden estimates?
FM: The team took the two burden estimates that existed at the time, determined the mid-point of those estimates, and then adjusted them to take into account the latest information on the fraction of disease caused by ETEC and Shigella. This starting point for the number of deaths was then used to estimate the number of cases of disease as well as the number of additional cases of stunting caused by these pathogens. Next, they took the number of additional children stunted and estimated how many of them might be likely to die due to other infectious diseases.
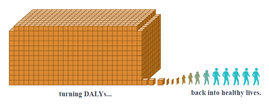
LE: Why is the burden represented in disability-adjusted life-years (DALYs), rather than just deaths or cases? Why are DALYs important to understand?
FM: DALYs, which measure disease burden as the number of healthy years of life lost due to either illness, disability, or early death, are a great way to capture the burden of both deaths and cases as well as the disability due to long-term consequences of ETEC and Shigella diarrhea. DALYs are also important as a metric to compare the burden of different diseases to understand their relative burden to one another.
LE: How will the burden estimates be used in decision-making about ETEC and Shigella prevention and control going forward?
FM: These burden estimates are only the first step in trying to expand our understanding of ETEC and Shigella disease burden beyond the disease directly caused by the pathogens. They also tell you which countries may have a higher burden of disease, as well as identify those countries that do not have any or very little disease. The work on the spatial disparity of disease burden within countries is especially important as we need to understand if everyone in a country is at equal risk for disease. Both sets of information are important as we try next to understand where vaccines may be most impactful and cost-effective.
LE: What do you see as the role of data visualization in turning these estimates into action?
FM: Many people process information visually. By putting these estimates into graphics that can tell a story, we are enabling people to quickly understand disease burden—not just how much, but where. I think this is great tool to use for advocacy and awareness. Having this tool available will allow us to reach non-scientific audiences such as policymakers in order to convey how important ETEC and Shigella are as causes of diarrheal disease burden within their countries and globally.
Check out the new visualization here and visit PATH's Center for Vaccine Innovation Access website to learn more about the development of ETEC and Shigella vaccines.