The power of models
|
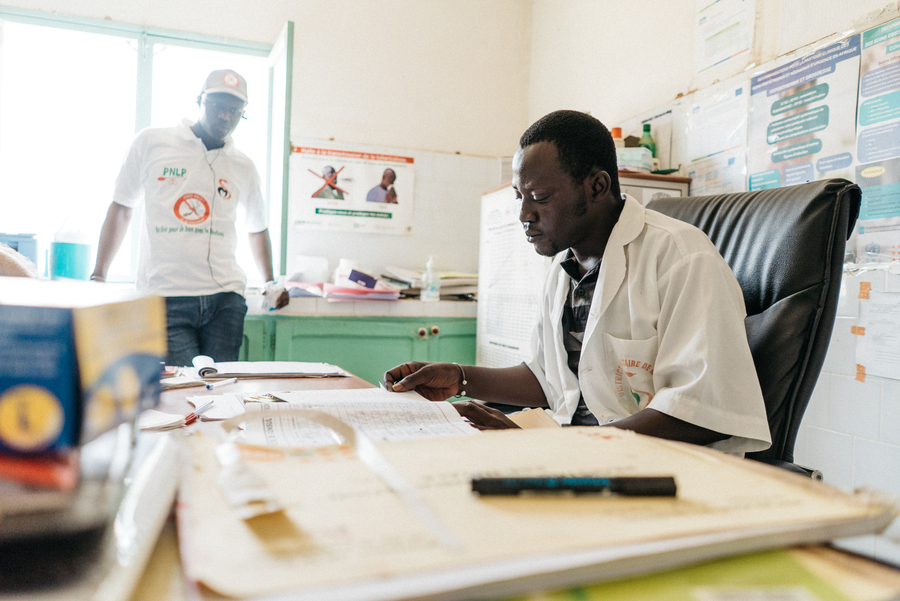
Models can help us thread the needle of health trends among diverse data collection methods, or, in some cases, incomplete data. Photo: PATH/Doune Porter.
Authored by: Chris Troeger, Julia Gall, Sean McKee, and Sofia Redford // IHME
In our last post, we described why statistical estimation makes it possible to identify the most burdensome diseases. But what are the techniques? In this post, we’ll explain how statistical models help combine the data that we collect and analyze to produce the estimates that the Global Burden of Disease (GBD) study publishes.
What is a model?
Every day we encounter and use statistical models. From producing weather predictions for the week, to calculating a country’s gross domestic product, to estimating the impact of vaccinations, models help us process, represent, and understand the data that describe the workings of the world around us.
At the highest level, a model generates a statistical representation of the real world. Surveillance data on the frequency of diarrhea episodes or deaths that were observed in a single population are fed into the models, and broader predictions of national or global diarrhea incidence and mortality are the output.
For example: You input a given sequence of shows into a streaming service like Netflix, and Netflix generates recommendations (outputs) based on the input data.
Why use a model?
Statistical models help us see the “forest through the trees,” or, in other words, detect the patterns that most likely reflect the real world amid the noise of imperfect data. Small sample sizes of studies, diverse methods, and all of the other variations that are introduced when trying to measure the same thing in different places or times – not to mention information gaps and other unknowns – can all lead to uncertainty in the data. A model can help identify trends that would otherwise be difficult to detect. Each model is built to take its particular data points and, from there, calculate predicted relationships.
Models and GBD
Models are used extensively in all kinds of health applications, including the GBD study. The models that allow for these estimations are a complex series of interconnected calculations. Experts in diseases, risk factors, and epidemiology develop each model. The models are then tested and vetted, with extensive review and debate by the researchers and scientists at IHME and our collaborators from around the world.
The GBD study is iterative. In every GBD update, statistical models are calculated for each age, sex, location, and year from at least 1990 onward. This ensures that each new iteration contains the most up-to-date estimates, reflecting all known advances in data, modeling, estimation methods, and health knowledge.
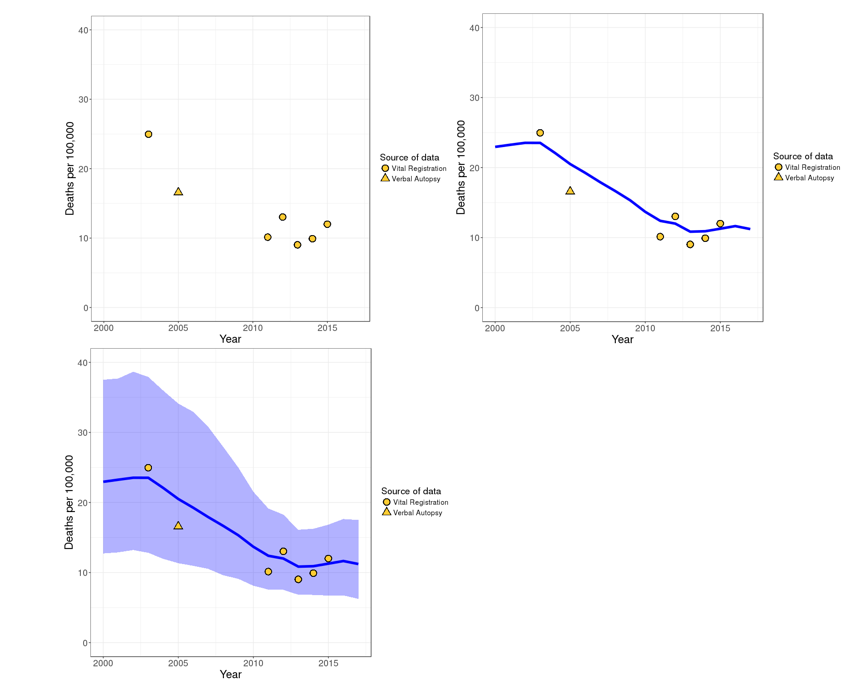
In the images below, which show a model for diarrhea in one country, you can see the process from data points (the yellow symbols), to average estimates (the blue line), to the range of possible values around the average estimate (the blue band). GBD researchers use models to determine the relationship between the known data points and the estimated range of possible values (researchers call this the “uncertainty interval”).
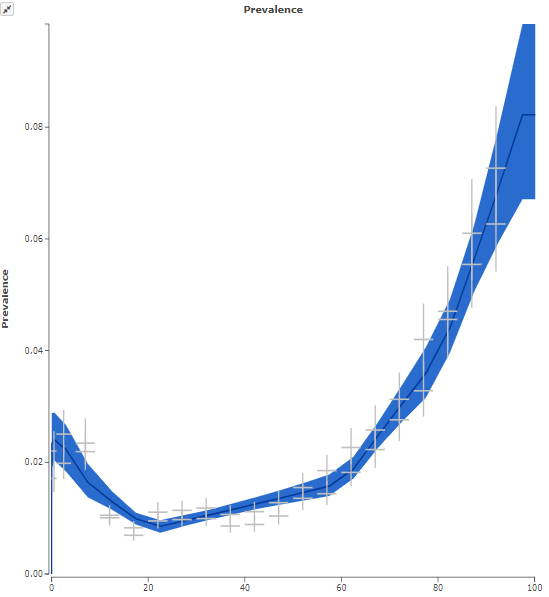
In this second example, which shows the prevalence of diarrhea in Ecuador, you can see how the model creates a trend line among diverse data sources. The gray points with cross-hatches represent different data sources that show the wide variation of the measured prevalence. The blue band represents the uncertainty interval, as discussed above, and the dark blue line at the center represents the estimate of the mean prevalence, as shown by the model’s processing of the various data sources. The model reveals the path – the forest – through the noise of the individual data points – the trees.
GBD’s first models – developed in the early 1990s – generated estimates for 107 diseases in eight regions and for five age groups. Since then, the models have continued to evolve not only to include more diseases, locations, and age groups, but to incorporate more source data and ever more scientifically advanced methods of calculation. GBD 2017, the most recently published iteration of the study, included over 100,000 data sources and 360 diseases and produced over 38 billion estimates!
How can models help defeat diarrhea?
GBD’s models of disease help give us a more comprehensive picture of the how, where, when, and who of different health factors. As we saw in the examples from Thailand and Ecuador, this can be applied directly to diarrhea – and even divided by different causes of diarrhea. This information is critical for decision-makers developing strategies, budgets, and target populations for diarrhea interventions like vaccines, oral rehydration solution, and zinc supplementation.
Interested in learning more? This post draws from our Acting on Data blog and the work of IHME.